Changes in the population of tradespeople between 2016 and 2021
Categories: Canada
Introduction
Over the last few decades, much concern and attention have been directed towards Canada’s aging labour force and, by extension, its impact on labour force growth and economic output, including increased demand in sectors such as healthcare and the skilled trades.
Reports on potential labour shortages in the skilled trades have been presented by labour organizations, think tanks and government agencies. For instance, more than 245,100 construction workers are expected to retire by 2032, creating a shortfall of just over 61,400 workers (BuildForce Canada, 2023). Recent data from Statistics Canada indicate that while Canada leads the G7 as the most educated workforce because of its large share of college and university graduates, the number of working-age (25 to 64 years) apprenticeship certificate holders has stagnated or fallen in critical fields, such as construction, mechanic and repair technologies, and precision production (Statistics Canada, 2022a). The COVID-19 pandemic in 2020 also caused record declines in trade registrations and certifications, which have yet to recover. This could lead to significant gaps in the supply and demand for journeypersons in the future, further worsening the potential labour shortage in the skilled trades (Statistics Canada, 2022b).
Using the Census of Population and the Job Vacancy and Wage Survey, this paper examines how the number and composition of tradespeople (specifically by age, gender, citizenship and choice of trade) have changed from 2016 to 2021 across Canada, and the degree to which labour shortages in the skilled trades may be experienced. Specifically, tradespeople employed in one of the Red Seal Trades on the Census of Population reference dates are studied.Note It is important to note that the 2021 Census was conducted in May 2021—just one year after the onset of the COVID-19 pandemic. At that time, the Canadian economy experienced recovering employment levels and easing COVID-19 restrictions, which allowed many businesses—especially those previously forced to close as “non-essential,” such as restaurants, gyms, theatres and salons—to re-open and operate at partial capacity (Statistics Canada, 2020). As a result, depending on the sector and region where journeypersons are typically employed, large differences may be recorded because of the varying effects the pandemic had on these sectors and regions.
The number of tradespeople employed in Canada declined between 2016 and 2021
In 2021, 1,620,680 tradespeople were employed in Canada, a decrease of 97,940 (-5.7%) from 2016. Declines were recorded in most of the occupations considered (28 out of 43), largely because of various COVID-19 restrictions and the unequal effects the pandemic had on different trades. The largest drops were recorded among cooks (-62,490, or -29.7%) and hairstylists and barbers (-34,240, or -34.1%), which accounted for most of the decline, followed by construction millwrights and industrial mechanics (-7,180, or -10.4%). During the same period, construction trades helpers and labourers (+20,120, or +12.4%), electricians (except industrial and power system) (+6,180, or +7.4%), and landscape and horticulture technicians and specialists (+5,830, or +31.6%) recorded the largest gains in the number of employed tradespeople.
Data table for Chart 1
| National Occupational Classification title | Percentage change between 2016 and 2021 |
|---|---|
| Landscape and horticulture technicians and specialists | 31.6 |
| Construction trades helpers and labourers | 12.4 |
| Electricians (except industrial and power system) | 7.4 |
| Construction millwrights and industrial mechanics | -10.4 |
| Cooks | -29.7 |
| Hairstylists and barbers | -34.1 |
Increases in non-permanent residents in the skilled trades mitigated the declines in tradespeople
Between 2016 and 2021, the number of immigrants (permanent residents and naturalized Canadian citizens) working in the trades decreased by 11.2% (-38,160). Although declines among immigrants were observed in most trades (30 out of 43), the largest declines were observed in the trades heavily affected by the COVID-19 pandemic, such as cooks (-20,220, or -32.7%), hairstylists (-9,240, or -37.2%), and painters and decorators (-3,110, or -22.4%). Excluding these three trades, the number of immigrants working in the trades decreased by 2.3% (-5,590).
In contrast, the number of non-permanent residents employed in the trades more than doubled (+128.0%) since 2016, increasing from 20,570 in 2016 to 47,000 in 2021. These gains in non-permanent residents were recorded in most trades (39 out of 43) and often mitigated the decline of immigrant and non-immigrant tradespeople. For instance, in trades such as welders and related machine operators, non-permanent residents added 1,640 workers, offsetting the declines reported by immigrants (-1,120) and non-immigrants (-3,880). A similar case is illustrated for automotive service technicians, truck and bus mechanics and mechanical repairers, where non-permanent residents added 1,490 workers to the industry, balancing the decline of 1,280 workers among immigrants. In other cases, gains in non-permanent residents mitigated what otherwise would have been decreases. For example, from 2016 to 2021, the number of bakers among non-permanent residents increased by 2,570 (+216.0%), while declining by 430 for immigrants and 950 for non-immigrants. Without the entry of non-permanent residents, the trade would have decreased by 1,380 instead of showing a net gain of 1,190 in 2021.
Large declines reported in most age groups, especially among youth (aged 15 to 24)
Over the decades, reports on the effects of Canada’s aging skilled trades workforce have drawn considerable attention, leading to initiatives aimed at replacing those who will be retiring soon. These initiatives include increasing immigration, enhancing recruitment and campaigns to attract prospective students, and changing high school graduation requirements to include a mandatory technical education credit to expose students to the trades (Employment and Social Development Canada, 2022).
From 2016 to 2021, the number of tradespeople 65 years or older increased by 8,460 (+11.8%). Part of this increase can be attributed to more baby boomers aging into this age cohort. During the same period, large declines were recorded in most other age groups. Specifically, the number of youth (aged 15 to 24) in the trades declined by 31,050 (-12.2%), while the number of young adults (aged 25 to 34), which make up one-quarter of total employed tradespeople, also declined by 15,990 (-3.8%). Most significantly, those aged 45 to 54, representing one-fifth of total employed tradespeople, recorded the largest declines (-75,290, or -20.2%). Many of these declines were recorded in 2021, when changes in working conditions, such as temporary closures and reduced operations because of the pandemic, contributed to decreased employment levels. While those in the 35 to 44 (+14,650, or +4.3%) and the 55 to 64 (+1,270, or +0.5%) age groups recorded gains, they fall considerably short of offsetting the declines reported in the other age groups. This suggests that the rate at which younger workers enter the trades across Canada was slower than the rate at which older workers leave, indicating a declining skilled trades population.
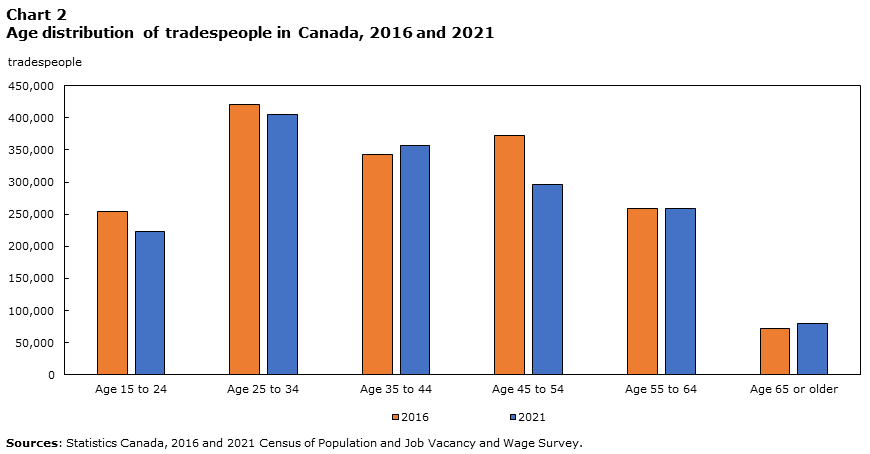
Data table for Chart 2
| Age 15 to 24 | Age 25 to 34 | Age 35 to 44 | Age 45 to 54 | Age 55 to 64 | Age 65 or older | |
|---|---|---|---|---|---|---|
| tradespeople | ||||||
| 2021 | 222,630 | 404,880 | 357,110 | 296,540 | 259,400 | 80,120 |
| 2016 | 253,680 | 420,870 | 342,460 | 371,820 | 258,130 | 71,660 |
When looking at the changes in the age distribution by region, data indicate that Ontario and Quebec were the largest contributors to the decline in tradespeople for the 45 to 54 age group. For Quebec, these declines were offset by gains in the other age groups. However, for Ontario and Alberta, which shared a similar trend, most other age groups also reported declines, further exacerbating the declining skilled trades population in these provinces.
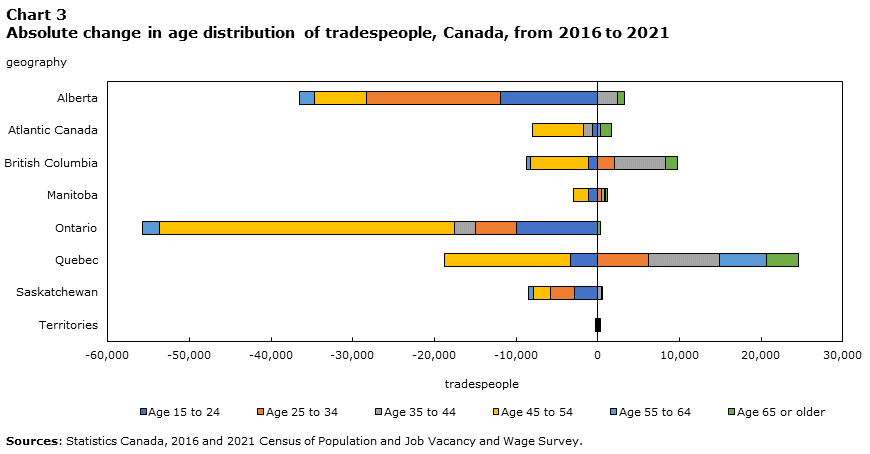
Data table for Chart 3
| Geography | Age 15 to 24 | Age 25 to 34 | Age 35 to 44 | Age 45 to 54 | Age 55 to 64 | Age 65 or older |
|---|---|---|---|---|---|---|
| tradespeople | ||||||
| Alberta | -11,920 | -16,470 | 2,380 | -6,310 | -1,810 | 880 |
| Atlantic Canada | -630 | -40 | -1,070 | -6,260 | 290 | 1,400 |
| British Columbia | -1,170 | 2,020 | 6,240 | -7,130 | -440 | 1,520 |
| Canada | -31,050 | -15,990 | 14,650 | -75,280 | 1,270 | 8,460 |
| Manitoba | -1,190 | 420 | 450 | -1,770 | 70 | 300 |
| Ontario | -9,940 | -5,000 | -2,660 | -36,070 | -2,060 | 350 |
| Quebec | -3,350 | 6,170 | 8,740 | -15,470 | 5,780 | 3,850 |
| Saskatchewan | -2,850 | -2,960 | 460 | -2,100 | -630 | 10 |
| Territories | 0 | -120 | 120 | -150 | 100 | 140 |
While the number of tradespeople declined in most age groups, the effect varied by trade and industry. From 2016, the number of tradespeople in each age group increased for industrial electricians, ironworkers and sheet metal workers. In many cases, the rate at which youth (aged 15 to 24) enter the trades was often faster than the rate at which older workers leave, indicating an increasing supply of tradespeople for these trades.
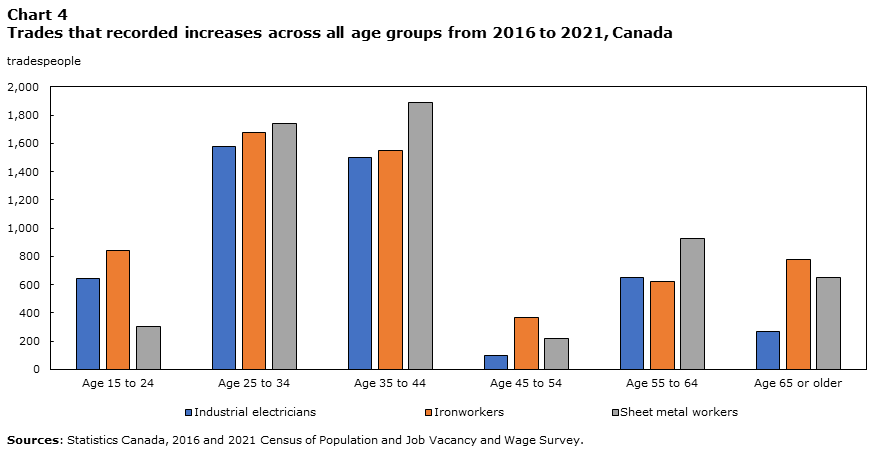
Data table for Chart 4
| National Occupational Classification title | Age 15 to 24 | Age 25 to 34 | Age 35 to 44 | Age 45 to 54 | Age 55 to 64 | Age 65 or older |
|---|---|---|---|---|---|---|
| tradespeople | ||||||
| Industrial electricians | 640 | 1580 | 1500 | 100 | 650 | 270 |
| Ironworkers | 840 | 1680 | 1550 | 370 | 620 | 780 |
| Sheet metal workers | 300 | 1740 | 1890 | 220 | 930 | 650 |
However, large declines were recorded in every age group for other trades such as bakers, roofers and shinglers, and cabinetmakers. The declines among bakers are likely attributed to the pandemic, when non-essential businesses were ordered to close, temporarily putting many people in these fields out of work.
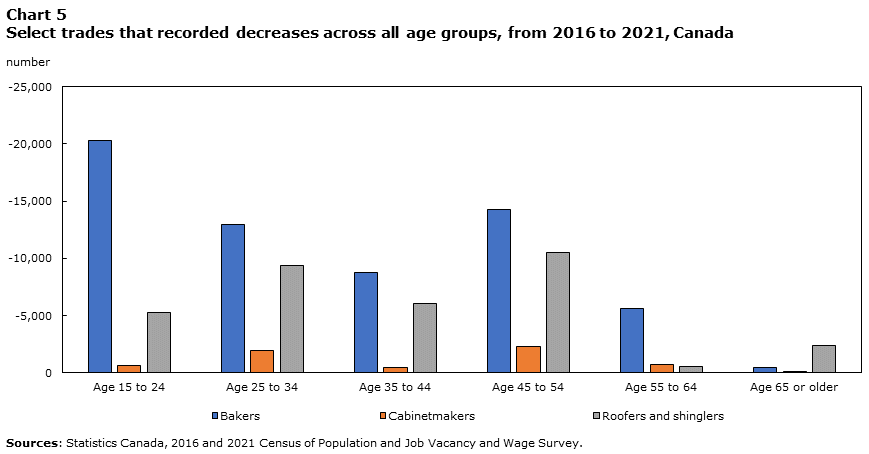
Data table for Chart 5
| National Occupational Classification title | Age 15 to 24 | Age 25 to 34 | Age 35 to 44 | Age 45 to 54 | Age 55 to 64 | Age 65 or older |
|---|---|---|---|---|---|---|
| number | ||||||
| Bakers | -20,330 | -12,990 | -8,760 | -14,310 | -5,660 | -450 |
| Cabinetmakers | -680 | -1,990 | -490 | -2,330 | -730 | -20 |
| Roofers and shinglers | -5,250 | -9,410 | -6,100 | -10,540 | -600 | -2,350 |
The demand for many trades increased, relative to labour supply, from 2016 to 2021
For individuals who did not work during the reference week, the census collects information about the occupation they held the longest since January 1 of the previous year, providing a measure of the distribution of the unemployed population by occupation.Note This can be compared with the distribution of job vacancies by occupation, providing insights into the balance between labour demand and supply for certain occupations.
For most trades, the ratio of the number of unemployed people to the number of job vacancies decreased from 2016 to 2021. This means that, relative to available supply, the demand for these trades has grown over the study period. For instance, notable declines were recorded from 2016 to 2021 for appliance services and repairs; heavy-duty equipment mechanics; construction millwrights and industrial mechanics; and heating, refrigeration and air conditioning mechanics.
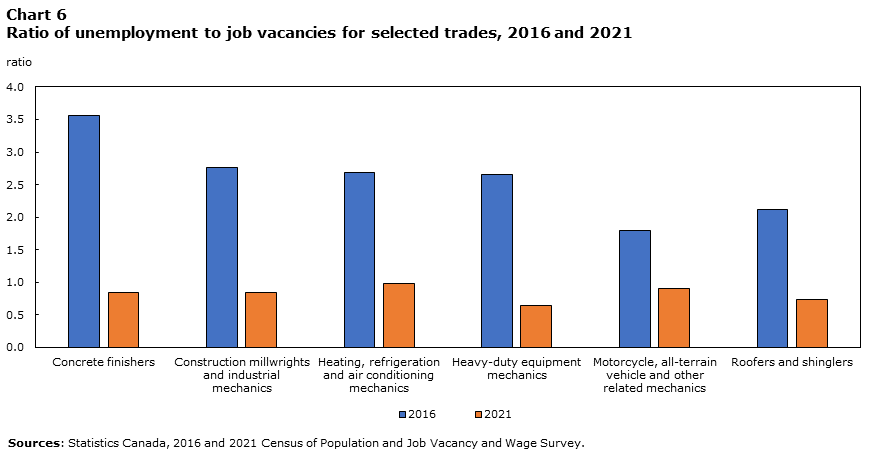
Data table for Chart 6
| National Occupational Classification title | 2016 | 2021 |
|---|---|---|
| ratio | ||
| Concrete finishers | 3.6 | 0.8 |
| Construction millwrights and industrial mechanics | 2.8 | 0.8 |
| Heating, refrigeration and air conditioning mechanics | 2.7 | 1.0 |
| Heavy-duty equipment mechanics | 2.7 | 0.6 |
| Motorcycle, all-terrain vehicle and other related mechanics | 1.8 | 0.9 |
| Roofers and shinglers | 2.1 | 0.7 |
Most tradespeople did not have a trade certificate
Many trades in Canada are not regulated. This means that a certificate is not mandatory to work in the occupation, even if the jurisdiction offers apprenticeship training. However, many job vacancies in the trades require prospective candidates to have a trade certificate, and most tradespeople (employed or unemployed) do not meet this criterion. For instance, of those working as tradespeople in 2021, just under one-third (32.8%) had a trade certificate, and a small number (6.5%) were in apprenticeship training in 2021.Note There were a few exceptions, such as electricians (70.2%) and plumbers (66.6%), where most tradespeople either had a certificate or were apprentices. Still, most tradespeople in 27 of the 43 trades were neither certified nor apprentices.
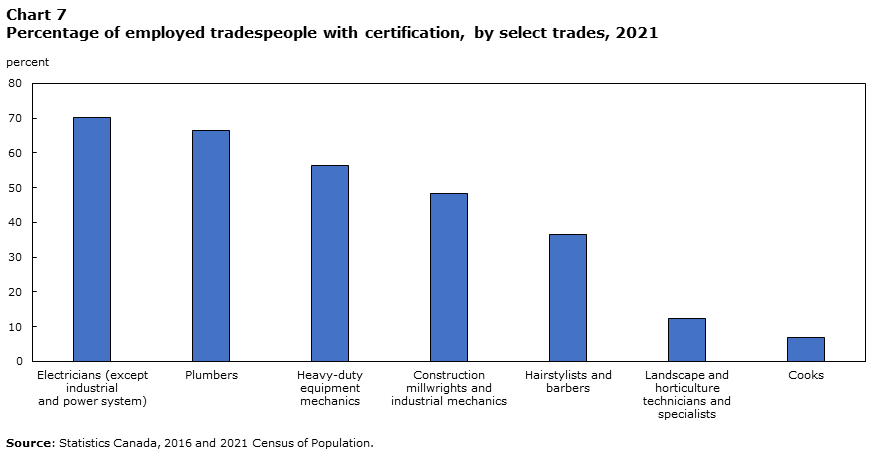
Data table for Chart 7
| National Occupational Classification title | Employed tradespeople with certification, by select trades, 2021 |
|---|---|
| percent | |
| Electricians (except industrial and power system) | 70.2 |
| Plumbers | 66.6 |
| Heavy-duty equipment mechanics | 56.4 |
| Construction millwrights and industrial mechanics | 48.4 |
| Hairstylists and barbers | 36.5 |
| Landscape and horticulture technicians and specialists | 12.2 |
| Cooks | 6.9 |
The certification rates were lower for unemployed people whose previous occupations were in a skilled trade, as about one in four (26.1%) had a trade certificate.Note
In other instances, the number of job vacancies requiring certified tradespeople were found to exceed the number of unemployed persons who met this criterion. This was observed for trades such as welders and related machine operators; construction millwrights and industrial mechanics; and heating, refrigeration and air conditioning mechanics. For these trades, more certified journeypersons are needed to meet this criterion employers have set for filling the vacancies with certified journeypersons. However, this can take considerable time, as apprenticeship training for these trades can take several years, during which employers may end up hiring employees with lower skill levels. Relatedly, many apprentices often do not certify within the program duration and many may discontinue as they progress through it (Statistics Canada, 2023a). Additionally, the COVID-19 pandemic has had lasting effects on trade certification rates. While registrations and earnings are recovering to pre-pandemic levels, certification rates continue to lag behind (Statistics Canada, 2023b).
Conclusion
Using data from the 2016 and the 2021 Census of Population and the Job Vacancy and Wage Survey, this paper examined how the composition of tradespeople differed between the two census years. Given that the 2021 Census was conducted in May 2021, one year after the onset of the pandemic, the COVID-19 restrictions had disproportionate effects across different sectors, potentially leading to unique change drivers. From 2016 to 2021, an overall decline in the number of tradespeople working in Canada coincided with a strong demand for trades such as appliance servicers and repairers; heavy-duty equipment mechanics; construction millwrights and industrial mechanics; and heating, refrigeration and air conditioning mechanics. In 2021, the number of job vacancies for these trades exceeded the number of unemployed people. This led to a tighter labour market for many trades, as many job vacancies required candidates to have a trade certificate, which many did not have. Furthermore, the decline in the number of tradespeople among those aged 15 to 34 and 45 to 54 coincided with gains in the older age groups (55 and older), suggesting an aging skilled trades workforce and a mismatch between the rate at which younger workers entering the trades and the rate at which older workers leaving.
Moving forward, with the incorporation of data from the 2026 Census of Population, further analysis could explore whether the trends observed in this paper persist or whether they were influenced by factors related to the pandemic. This ongoing analysis is essential for understanding Canada’s trade sector dynamics.
References
BuildForce Canada. (2023). Construction and Maintenance Looking Forward: An assessment of construction labour markets from 2023 to 2032 . BuildForce Canada.
Employment and Social Development Canada. (2022, April 26). Government of Canada bolsters the skilled trades sector by investing in training. Retrieved from Government of Canada
Statistics Canada. (2020, May 5). Labour Force Survey, May 2020. Retrieved from Statistics Canada
Statistics Canada. (2022a, November 30). Canada leads the G7 for the most educated workforce, thanks to immigrants, young adults and a strong college sector, but is experiencing significant losses in apprenticeship certificate holders in key trades
Statistics Canada. (2022b, December 06). Registered apprenticeship training programs, 2021. Retrieved from Statistics Canada
Statistics Canada. (2023a, August 28). Certification, continuation and discontinuation rates of newly registered apprentices within program duration, 1.5 times program duration and 2 times program duration. Canada. Retrieved from Statistics Canada
Statistics Canada. (2023b, December 05). Registered apprenticeship training programs, 2022. Retrieved from Statistics Canada
Appendix Additional charts and tables
| National Occupational Classification title | Percentage change |
|---|---|
| Sources: Statistics Canada, 2026 and 2021 Census of Population and the Job Vacancy and Wage Survey. | |
| Oil and solid fuel heating mechanics | -37.7 |
| Hairstylists and barbers | -34.1 |
| Cooks | -29.7 |
| Floor covering installers | -28.8 |
| Other technical trades and related occupations | -27.4 |
| Industrial electricians | -23.8 |
| Appliance servicers and repairers | -20.9 |
| Concrete finishers | -20.9 |
| Glaziers | -16.8 |
| Tool and die makers | -16.7 |
| Tilesetters | -14.4 |
| Painters and decorators (except interior decorators) | -13.9 |
| Cabinetmakers | -12.7 |
| Insulators | -11.7 |
| Construction millwrights and industrial mechanics | -10.4 |
| Boilermakers | -10.1 |
| Bricklayers | -9.7 |
| Crane operators | -7.4 |
| Steamfitters, pipefitters and sprinkler system installers | -7.3 |
| Gas fitters | -6.5 |
| Sheet metal workers | -5.6 |
| Plasterers, drywall installers and finishers and lathers | -5.3 |
| Machinists and machining and tooling inspectors | -5.1 |
| Auto body collision, refinishing and glass technicians and damage repair estimators | -3.9 |
| Welders and related machine operators | -3.9 |
| Ironworkers | -3.8 |
| Industrial instrument technicians and mechanics | -3.3 |
| Automotive service technicians, truck and bus mechanics and mechanical repairers | -2.8 |
| Roofers and shinglers | 0.2 |
| Storekeepers and partspersons | 2.0 |
| Plumbers | 2.0 |
| Carpenters | 2.3 |
| Bakers | 2.9 |
| Electrical power line and cable workers | 5.0 |
| Heavy equipment operators | 7.1 |
| Electricians (except industrial and power system) | 7.4 |
| Electrical mechanics | 9.4 |
| Structural metal and platework fabricators and fitters | 11.5 |
| Construction trades helpers and labourers | 12.4 |
| Heavy-duty equipment mechanics | 15.3 |
| Motorcycle, all-terrain vehicle and other related mechanics | 17.2 |
| Heating, refrigeration and air conditioning mechanics | 19.5 |
| Landscape and horticulture technicians and specialists | 31.6 |
| National Occupational Classification title | 2016 | 2021 |
|---|---|---|
| ratio | ||
| Sources: Statistics Canada, 2016 and 2021 Census of Population and the Job Vacancy and Wage Survey. | ||
| Appliance servicers and repairers | 1.8 | 0.6 |
| Automotive service technicians, truck and bus mechanics and mechanical repairers | 2.7 | 1.3 |
| Bakers | 3.4 | 4.4 |
| Cabinetmakers | 3.3 | 1.3 |
| Carpenters | 7.3 | 1.6 |
| Concrete finishers | 3.6 | 0.8 |
| Construction millwrights and industrial mechanics | 2.8 | 0.8 |
| Construction trades helpers and labourers | 6.1 | 1.8 |
| Cooks | 1.8 | 1.8 |
| Crane operators | 15.0 | 2.3 |
| Electrical mechanics | 1.5 | 0.4 |
| Electrical power line and cable workers | 12.3 | 4.0 |
| Electricians (except industrial and power system) | 10.2 | 2.9 |
| Glaziers | 2.8 | 13.0 |
| Hairstylists and barbers | 0.9 | 6.7 |
| Heating, refrigeration and air conditioning mechanics | 2.7 | 1.0 |
| Heavy equipment operators | 13.9 | 2.8 |
| Heavy-duty equipment mechanics | 2.7 | 0.6 |
| Industrial electricians | 10.3 | 2.5 |
| Industrial instrument technicians and mechanics | 7.9 | 1.9 |
| Ironworkers | 6.1 | 3.3 |
| Landscape and horticulture technicians and specialists | 1.4 | 1.1 |
| Machinists and machining and tooling inspectors | 2.2 | 1.2 |
| Motorcycle, all-terrain vehicle and other related mechanics | 1.8 | 0.9 |
| Other technical trades and related occupations | 4.8 | 1.3 |
| Painters and decorators (except interior decorators) | 7.6 | 3.6 |
| Plasterers, drywall installers and finishers and lathers | 3.3 | 1.9 |
| Plumbers | 4.3 | 1.7 |
| Roofers and shinglers | 2.1 | 0.7 |
| Sheet metal workers | 10.4 | 1.6 |
| Steamfitters, pipefitters and sprinkler system installers | 11.6 | 4.1 |
| Storekeepers and partspersons | 2.8 | 1.4 |
| Structural metal and platework fabricators and fitters | 2.4 | 1.3 |
| Tool and die makers | 1.2 | 1.8 |
| Welders and related machine operators | 5.7 | 1.5 |
| National Occupational Classification title | Percentage certified, 2021 |
|---|---|
| Source: Statistics Canada, 2016 and 2021 Census of Population. | |
| Industrial electricians | 75.8 |
| Boilermakers | 71.5 |
| Steamfitters, pipefitters and sprinkler system installers | 71.1 |
| Electricians (except industrial and power system) | 70.2 |
| Plumbers | 66.6 |
| Electrical power line and cable workers | 66.4 |
| Heating, refrigeration and air conditioning mechanics | 57.3 |
| Heavy-duty equipment mechanics | 56.4 |
| Industrial instrument technicians and mechanics | 55.5 |
| Sheet metal workers | 54.4 |
| Construction millwrights and industrial mechanics | 48.4 |
| Ironworkers | 47.9 |
| Automotive service technicians, truck and bus mechanics and mechanical repairers | 46.5 |
| Oil and solid fuel heating mechanics | 41.5 |
| Tool and die makers | 40.4 |
| Gas fitters | 39.5 |
| Crane operators | 38.6 |
| Carpenters | 37.4 |
| Auto body collision, refinishing and glass technicians and damage repair estimators | 36.7 |
| Motorcycle, all-terrain vehicle and other related mechanics | 36.6 |
| Hairstylists and barbers | 36.5 |
| Bricklayers | 36.1 |
| Insulators | 35.6 |
| Welders and related machine operators | 35.3 |
| All included trades | 32.8 |
| Glaziers | 31.8 |
| Structural metal and platework fabricators and fitters | 30.8 |
| Machinists and machining and tooling inspectors | 30.1 |
| Plasterers, drywall installers and finishers and lathers | 24.5 |
| Electrical mechanics | 23.3 |
| Appliance servicers and repairers | 23.1 |
| Tilesetters | 23.1 |
| Concrete finishers | 22.8 |
| Other technical trades and related occupations | 19.5 |
| Roofers and shinglers | 18.1 |
| Cabinetmakers | 16.8 |
| Floor covering installers | 15.8 |
| Painters and decorators (except interior decorators) | 14.8 |
| Storekeepers and partspersons | 14.1 |
| Heavy equipment operators | 12.7 |
| Landscape and horticulture technicians and specialists | 12.2 |
| Construction trades helpers and labourers | 10.2 |
| Cooks | 6.9 |
| Bakers | 6.4 |
| NOC code | NOC title | Red Seal Trade |
|---|---|---|
| Notes: NOC = National Occupational Classification. During the timeframe of this study, two trades (electric motor system technicians and rig technicians) were designated as a Red Seal Trade and were therefore included. However, electric motor system technicians were de-designated as a Red Seal Trade in July 2022, and rig technicians were de-designated in June of 2021. | ||
| 14401 | Storekeepers and partspersons | Parts Technician |
| 22114 | Landscape and horticulture technicians and specialists | Landscape Horticulturist |
| 22312 | Industrial instrument technicians and mechanics | Instrumentation and Control Technician |
| 63200 | Cooks | Cook |
| 63202 | Bakers | Baker |
| 63210 | Hairstylists and barbers | Hairstylist |
| 72100 | Machinists and machining and tooling inspectors | Machinist |
| 72101 | Tool and die makers | Tool and Die Maker |
| 72102 | Sheet metal workers | Sheet Metal Worker |
| 72103 | Boilermakers | Boilermaker |
| 72104 | Structural metal and platework fabricators and fitters | Metal Fabricator (Fitter) |
| 72105 | Ironworkers | Ironworker (Generalist) Ironworker (Reinforcing) Ironworker (Structural/Ornamental) |
| 72106 | Welders and related machine operators | Welder |
| 72200 | Electricians (except industrial and power system) | Construction Electrician |
| 72201 | Industrial electricians | Industrial Electrician |
| 72203 | Electrical power line and cable workers | Powerline Technician |
| 72300 | Plumbers | Plumber |
| 72301 | Steamfitters, pipefitters and sprinkler system installers | Sprinkler Fitter Steamfitter/Pipefitter |
| 72302 | Gas fitters | Gasfitter – Class A Gasfitter – Class B |
| 72310 | Carpenters | Carpenter |
| 72311 | Cabinetmakers | Cabinetmaker |
| 72320 | Bricklayers | Bricklayer |
| 72321 | Insulators | Insulator (Heat and Frost) |
| 72400 | Construction millwrights and industrial mechanics | Industrial Mechanic (Millwright) |
| 72401 | Heavy-duty equipment mechanics | Agricultural Equipment Technician Heavy Duty Equipment Technician |
| 72402 | Heating, refrigeration and air conditioning mechanics | Refrigeration and Air Conditioning Mechanic |
| 72410 | Automotive service technicians, truck and bus mechanics and mechanical repairers | Automotive Service Technician Transport Trailer Technician Truck and Transport Mechanic |
| 72411 | Auto body collision, refinishing and glass technicians and damage repair estimators | Auto Body and Collision Technician Automotive Refinishing Technician |
| 72420 | Oil and solid fuel heating mechanics | Oil Heat System Technician |
| 72421 | Appliance servicers and repairers | Appliance Service Technician |
| 72423 | Motorcycle, all-terrain vehicle and other related mechanics | Motorcycle Mechanic Recreation Vehicle Service Technician |
| 72500 | Crane operators | Mobile Crane Operator Tower Crane Operator |
| 73100 | Concrete finishers | Concrete Finisher |
| 73101 | Tilesetters | Tilesetter |
| 73102 | Plasterers, drywall installers and finishers and lathers | Drywall Finisher and Plasterer Lather (Interior Systems Mechanic) |
| 73110 | Roofers and shinglers | Roofer |
| 73111 | Glaziers | Glazier |
| 73112 | Painters and decorators (except interior decorators) | Painter and Decorator |
| 73113 | Floor covering installers | Floorcovering Installer |
| 73400 | Heavy equipment operators | Heavy Equipment Operator (Dozer) Heavy Equipment Operator (Excavator) Heavy Equipment Operator (Tractor–Loader–Backhoe) |
| 75110 | Construction trades helpers and labourers | Construction Craft Worker |
Note to readers
Data sources
Using the 2016 and the 2021 Census of Population, tradespeople who were employed in one of the Red Seal Trades on the census reference dates are studied. Although the majority of journeypersons had only one certification record, some received multiple certificates across trades or jurisdictions. This study considers only the most recent certification record of an individual. If the journeyperson received multiple certificates on the same day, one was chosen at random.
The Job Vacancy and Wage Survey provides comprehensive data on job vacancies and offered wages by industrial sector and detailed occupation for Canada, including by province, territory and economic region. Job vacancy and offered wage data are released quarterly. In this paper, the number of job vacancies in the years of interest (2016 and 2021) were calculated by taking the estimates of the second quarter.
In this paper, tradespeople who were employed in one of the Red Seal Trades on the Census of Population reference dates are studied. This does not necessarily mean that these tradespeople hold a Red Seal endorsement or have a certificate of qualification in the trade. In May 2021, when the 2021 Census was conducted, there were 56 Red Seal trades in Canada. Some of these trades share the same National Occupational Classification (NOC) code, and 43 occupations (five-digit NOC code) that contain Red Seal Trades are studied in this paper.
Definitions
An immigrant is a person who is, or who has ever been, a landed immigrant or permanent resident. Such a person has been granted the right to live in Canada permanently by immigration authorities. Immigrants who have obtained Canadian citizenship by naturalization are included in this group.
Journeypersons are individuals who passed the qualification exam and received their certificate of qualification from the apprenticeship authority. One can become a journeyperson through apprenticeship training or challenging the exam without becoming a registered apprentice. When a distinction is necessary, the latter cases are referred to as trade qualifiers.
A non-permanent resident is a person from another country with a usual place of residence in Canada who has a work or study permit or has claimed refugee status (asylum claimant). Family members living with work or study permit holders are also included unless these family members are already Canadian citizens, landed immigrants or permanent residents.
Red Seal Trades are designated trades to help set common standards across trades and facilitate the mobility of skilled workers across Canada. The Canadian Council of Directors of Apprenticeship administers the Red Seal Program. Journeypersons who have passed the Red Seal examination receive a Red Seal endorsement on their provincial or territorial trade certificate. When affixed to a provincial or territorial trade certificate, the Red Seal indicates that a tradesperson has demonstrated the knowledge required for the national standard in that trade. In May 2021, when the 2021 Census was conducted, there were 56 Red Seal Trades in Canada. As some trades share the same NOC code, these 56 Red Seal trades are classified as 43 occupations (five-digit NOC) in this study.